
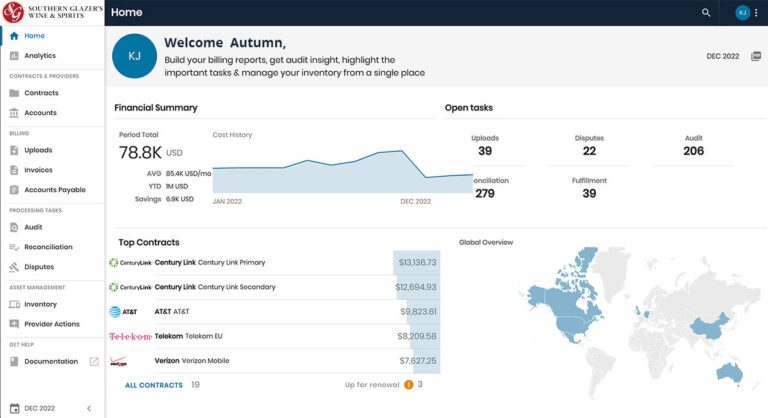
You primary dashboard will give you a glance into:
- telecom spending trends
- top contracts by spend level
- open disputes with carriers
- and more
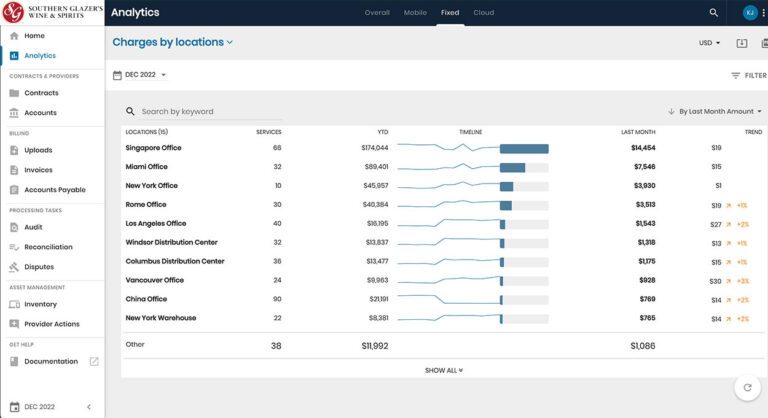
Pre-configured reports will show your telecom spend sliced in multiple ways:
- by locations
- by providers
- by cost centers
- by contracts
- by services
- by top spenders
- and more
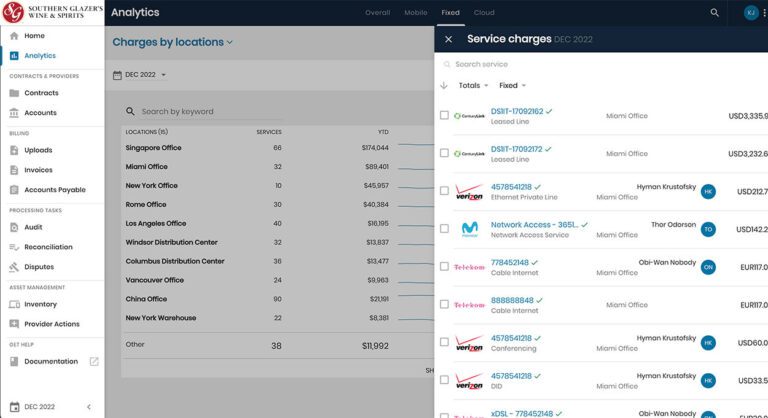
Simply click on a location and you’ll drill down into the individual charges.
But it doesn’t stop there. You can actually drill down three more layers into each charge to see data like:
- charges
- usage
- plans & features
- activity
- cost history
- and more
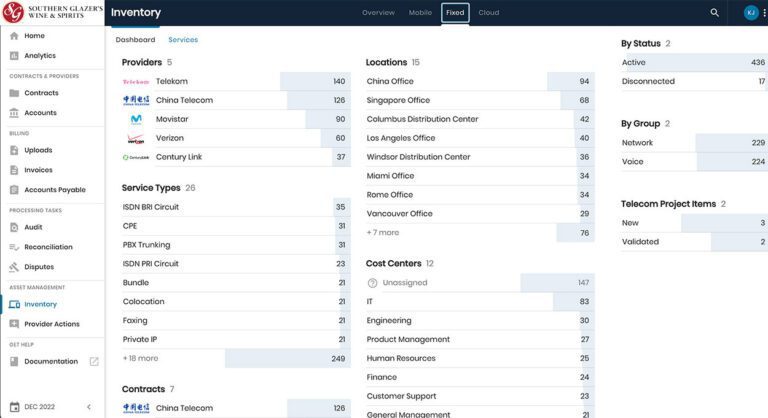
Your inventory page provides a high-level view and allows you to click deeper into each field.
You’ll be able to click into any of these fields and see data such as:
- individual contracts
- charges
- usage
- and more